Energy Efficiency / Customer Journey Stage 03 / Evaluate and Compare
Cost-Over-Time-Slider
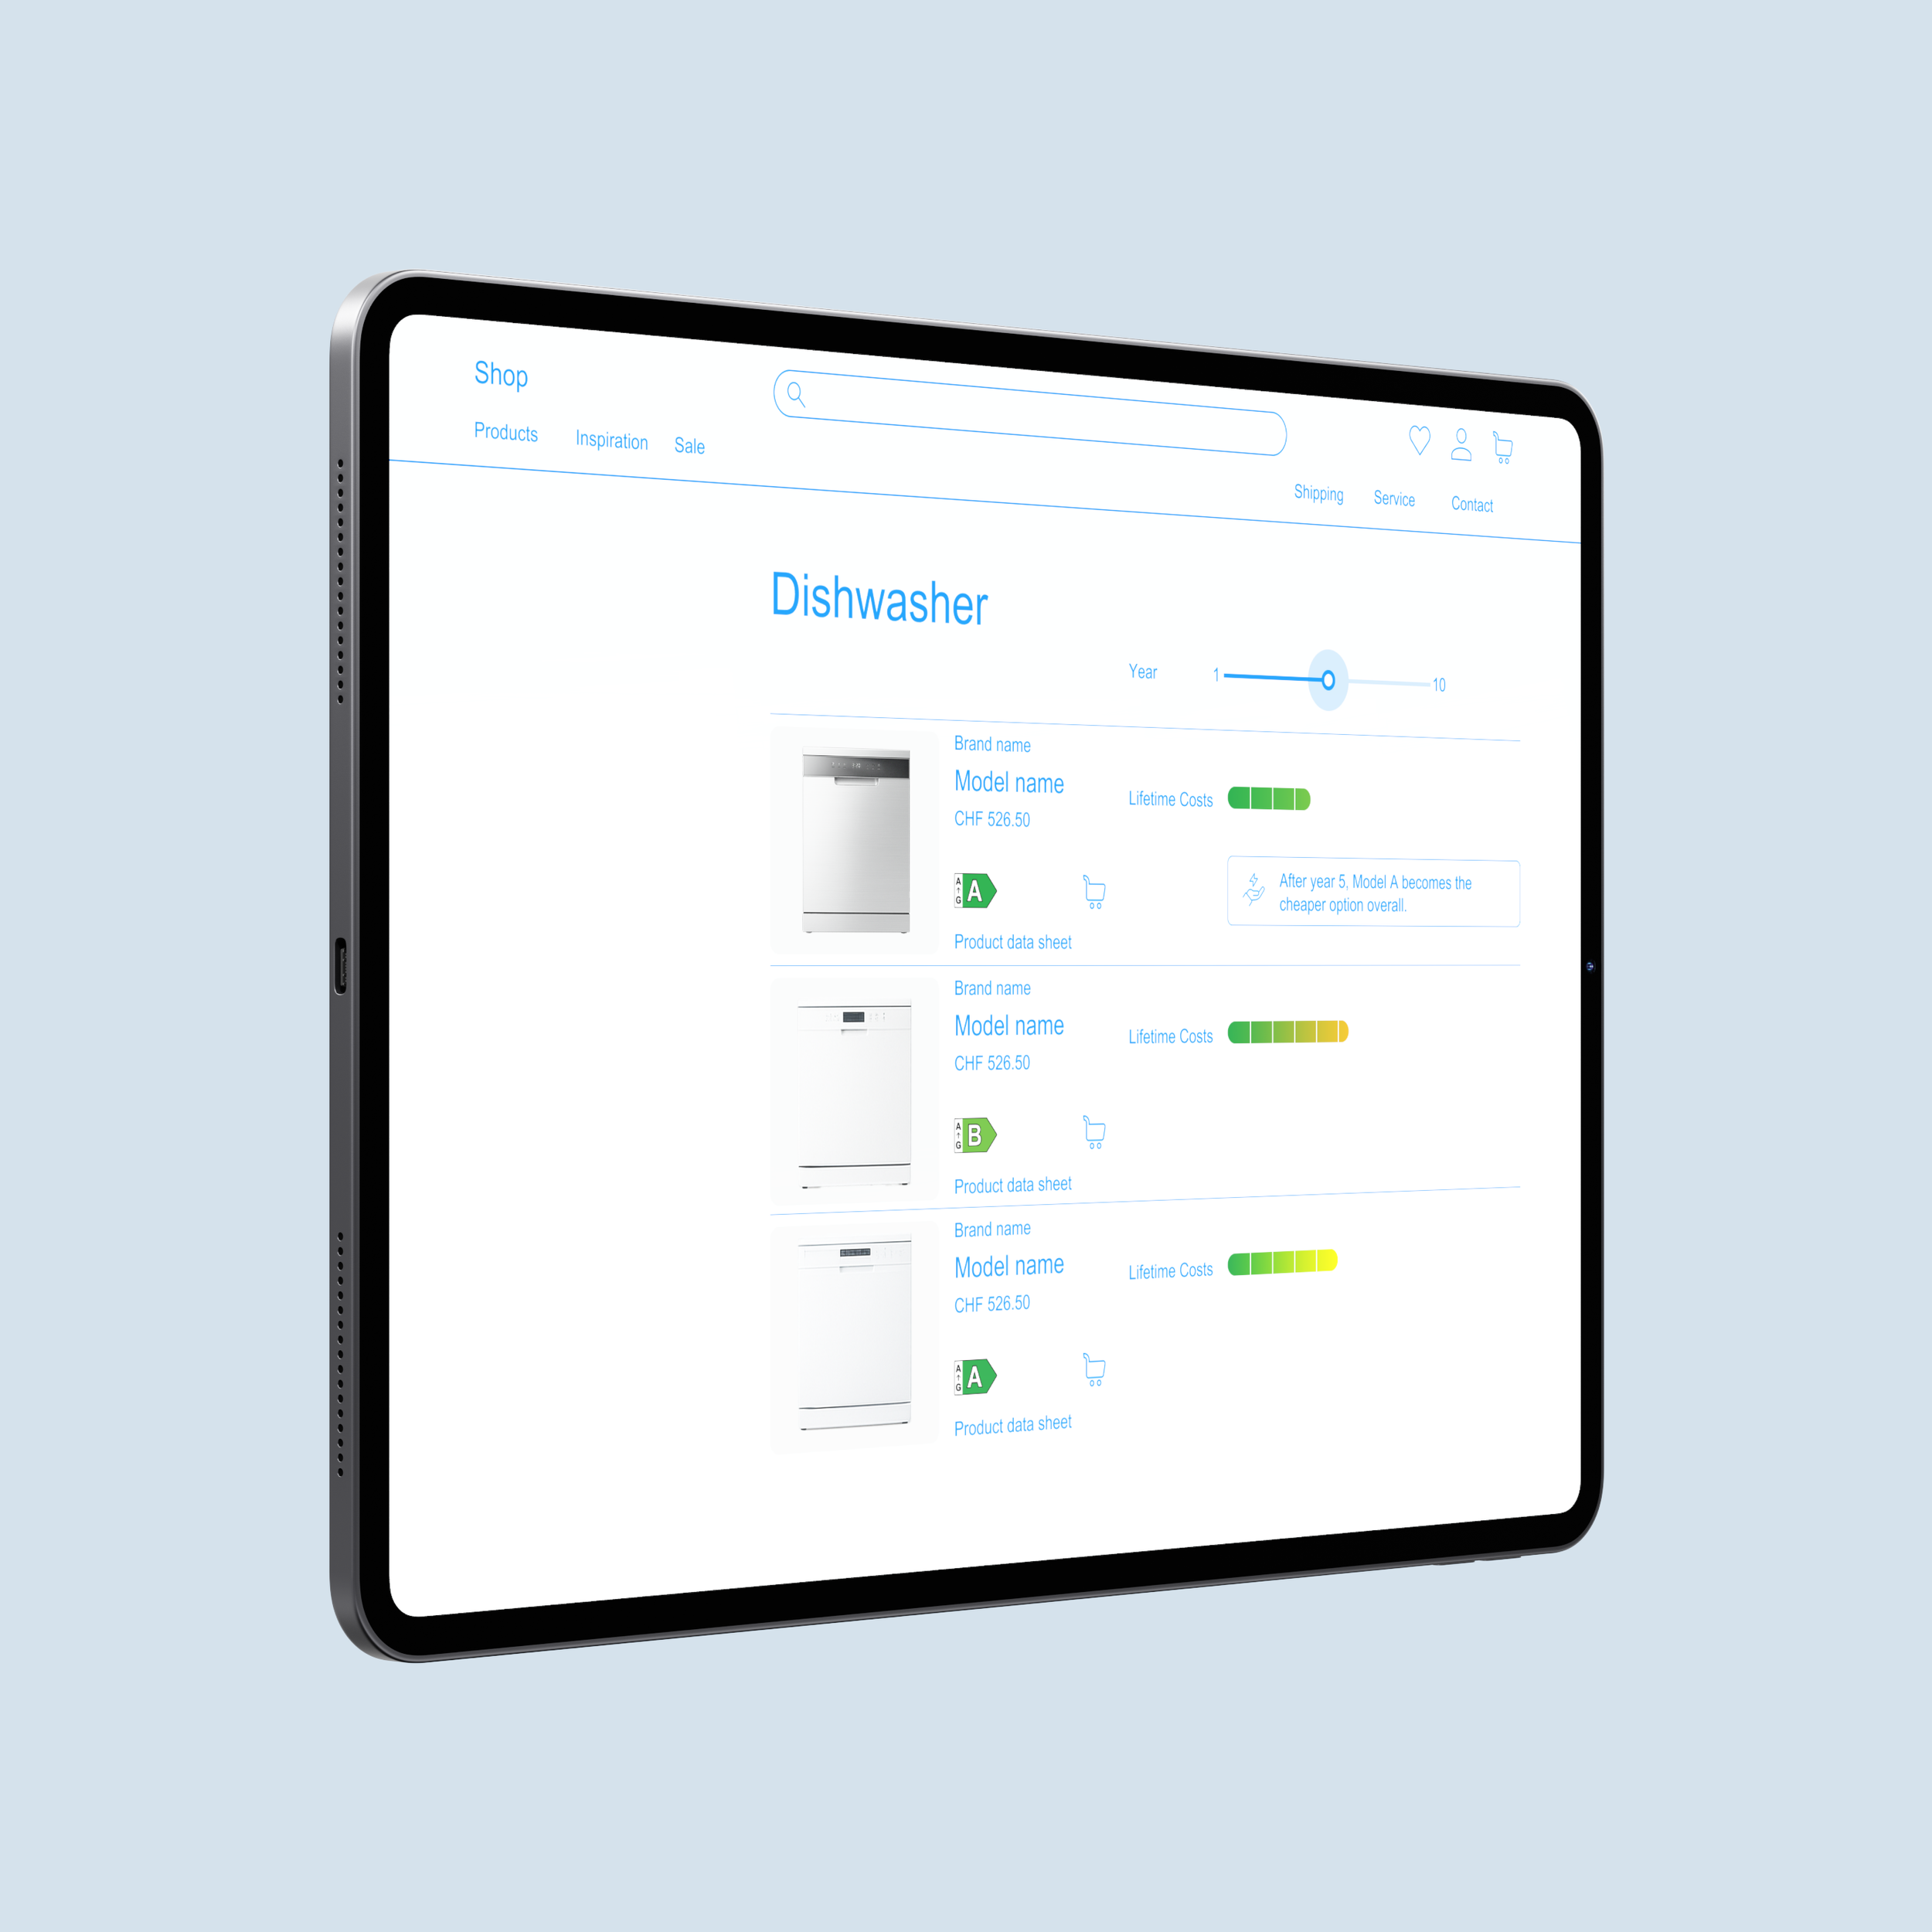
Use this pattern to put purchase price and lifetime energy costs for your customers in perspective. A slider lets users move forward in time and see how operating costs accumulate over several years.

Why? A purchase price is immediate, visible and certain; energy costs are delayed, distributed and abstract. This patterns makes the total cost of ownership visible.
How it works
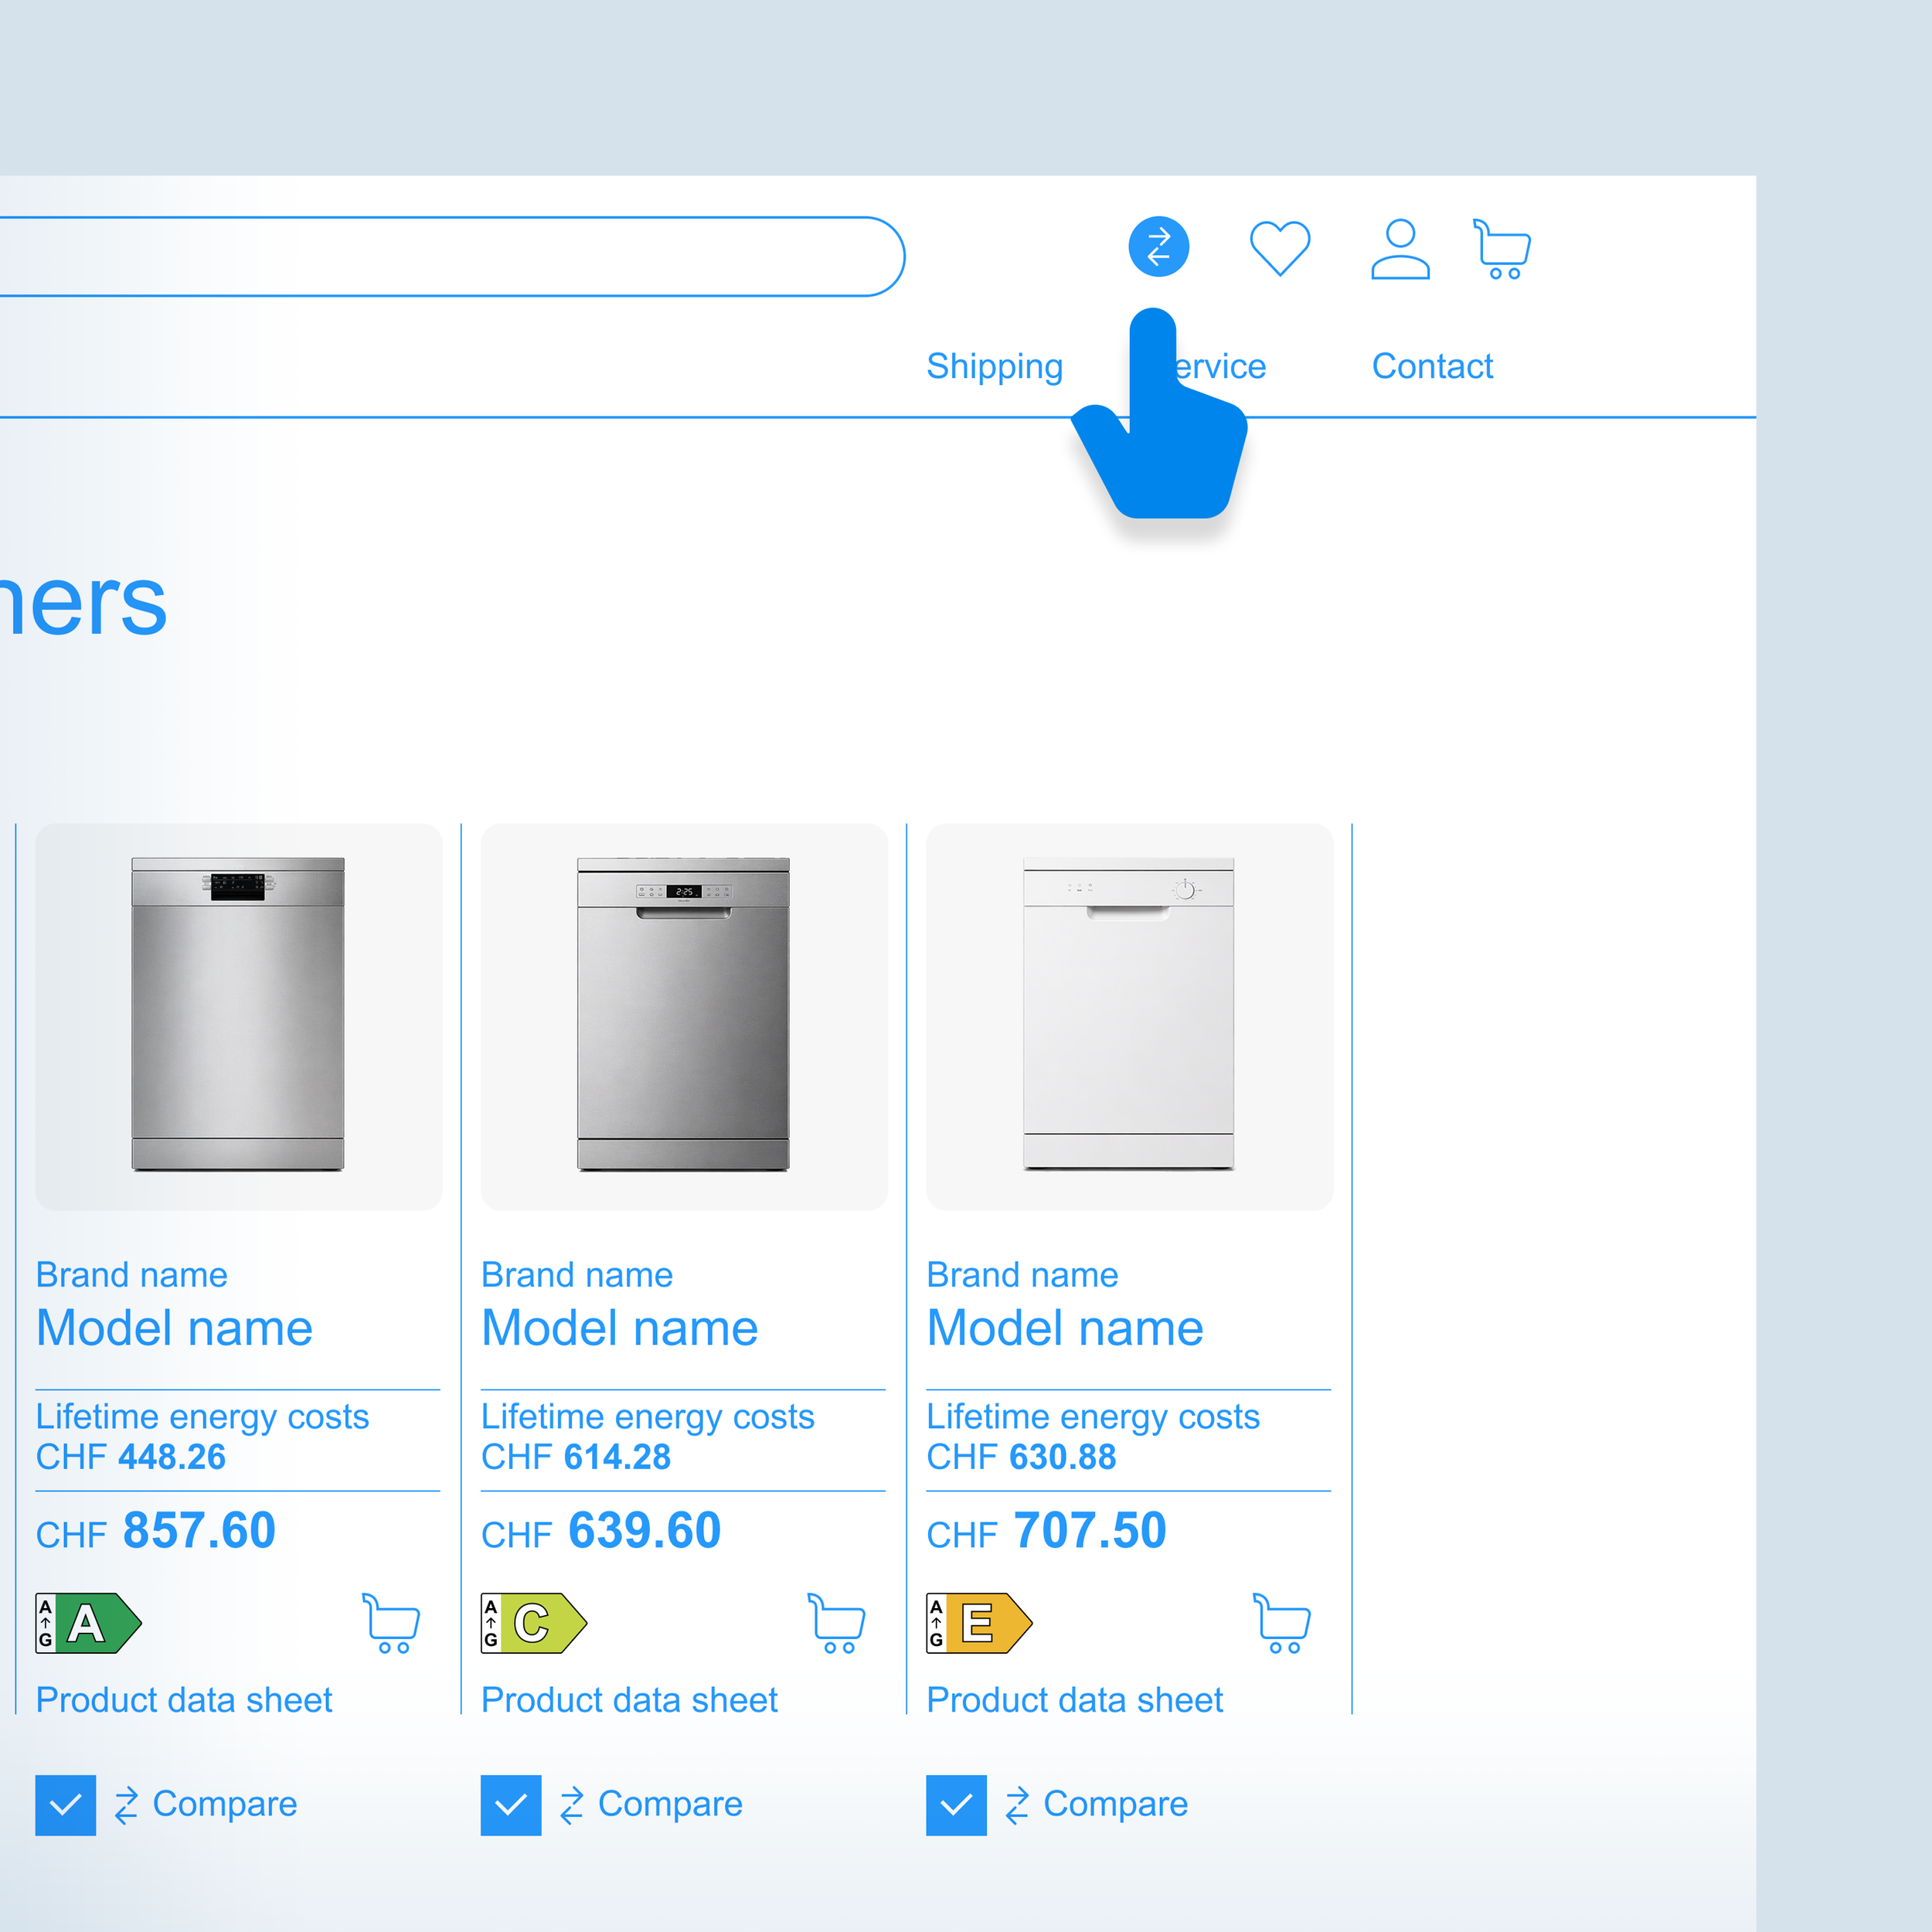
Users select products from a listing and add them to comparison.
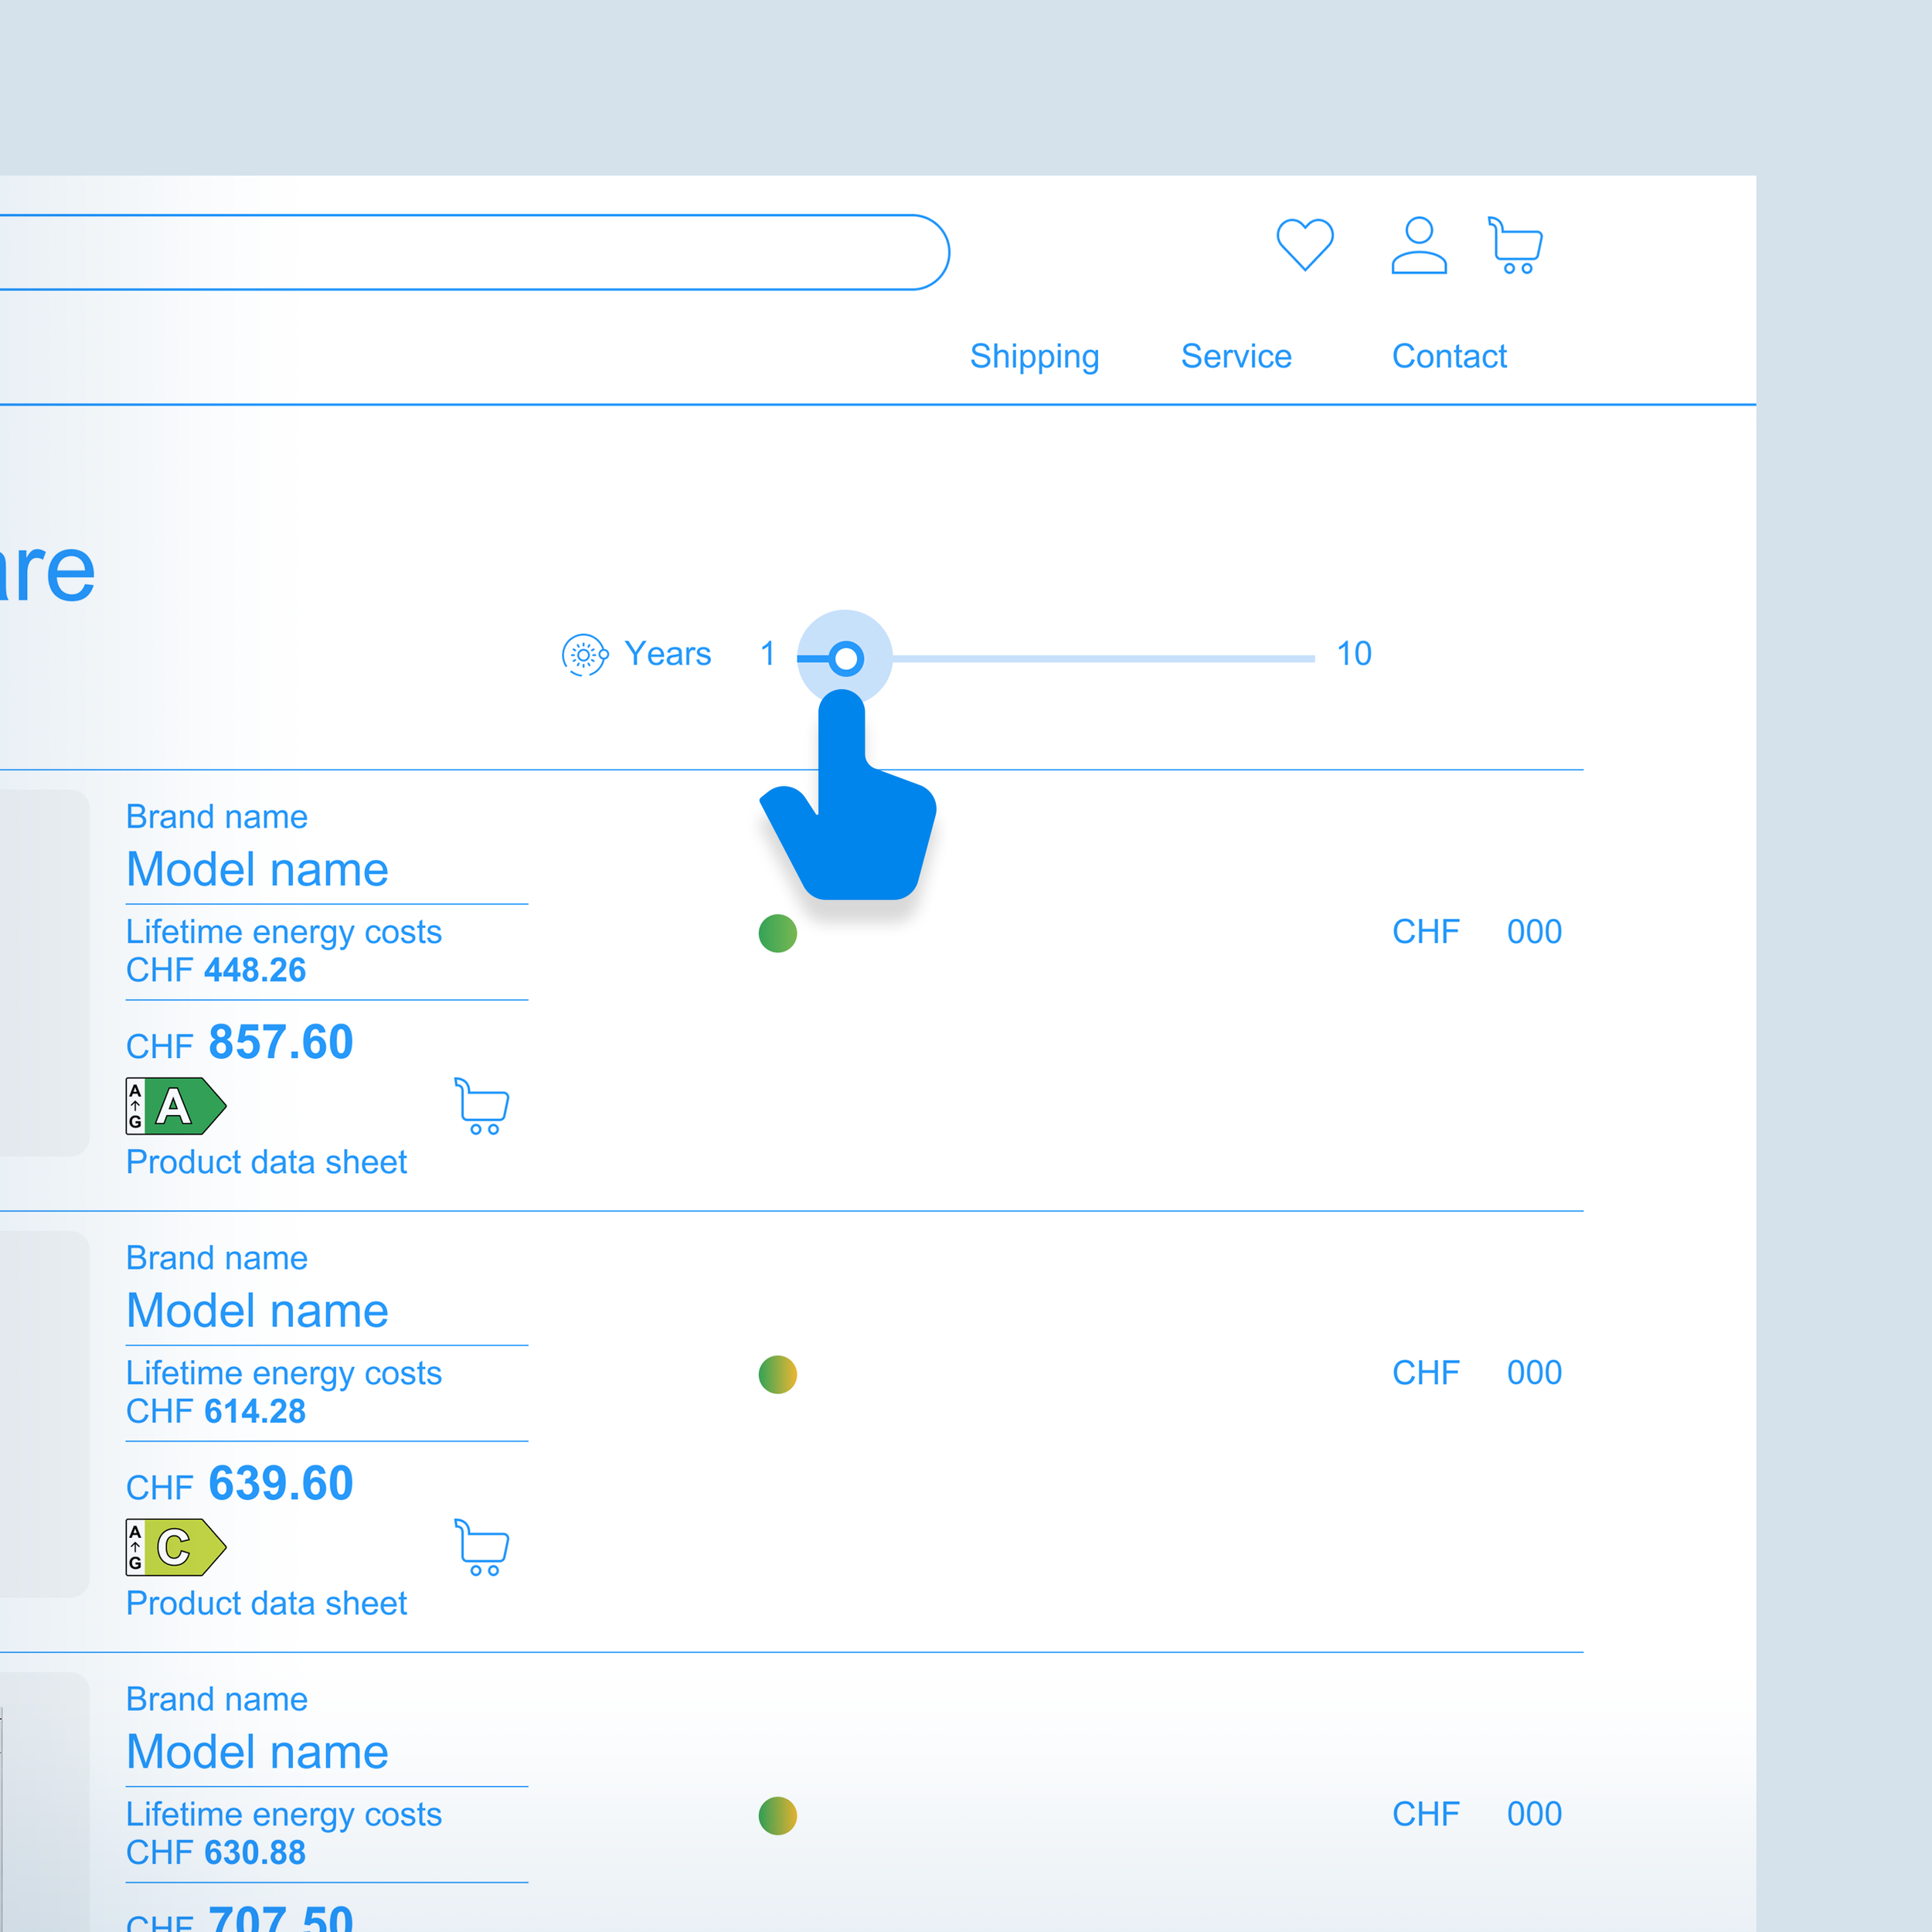
Above the comparison, a slider lets users move from year 1 to year 10.
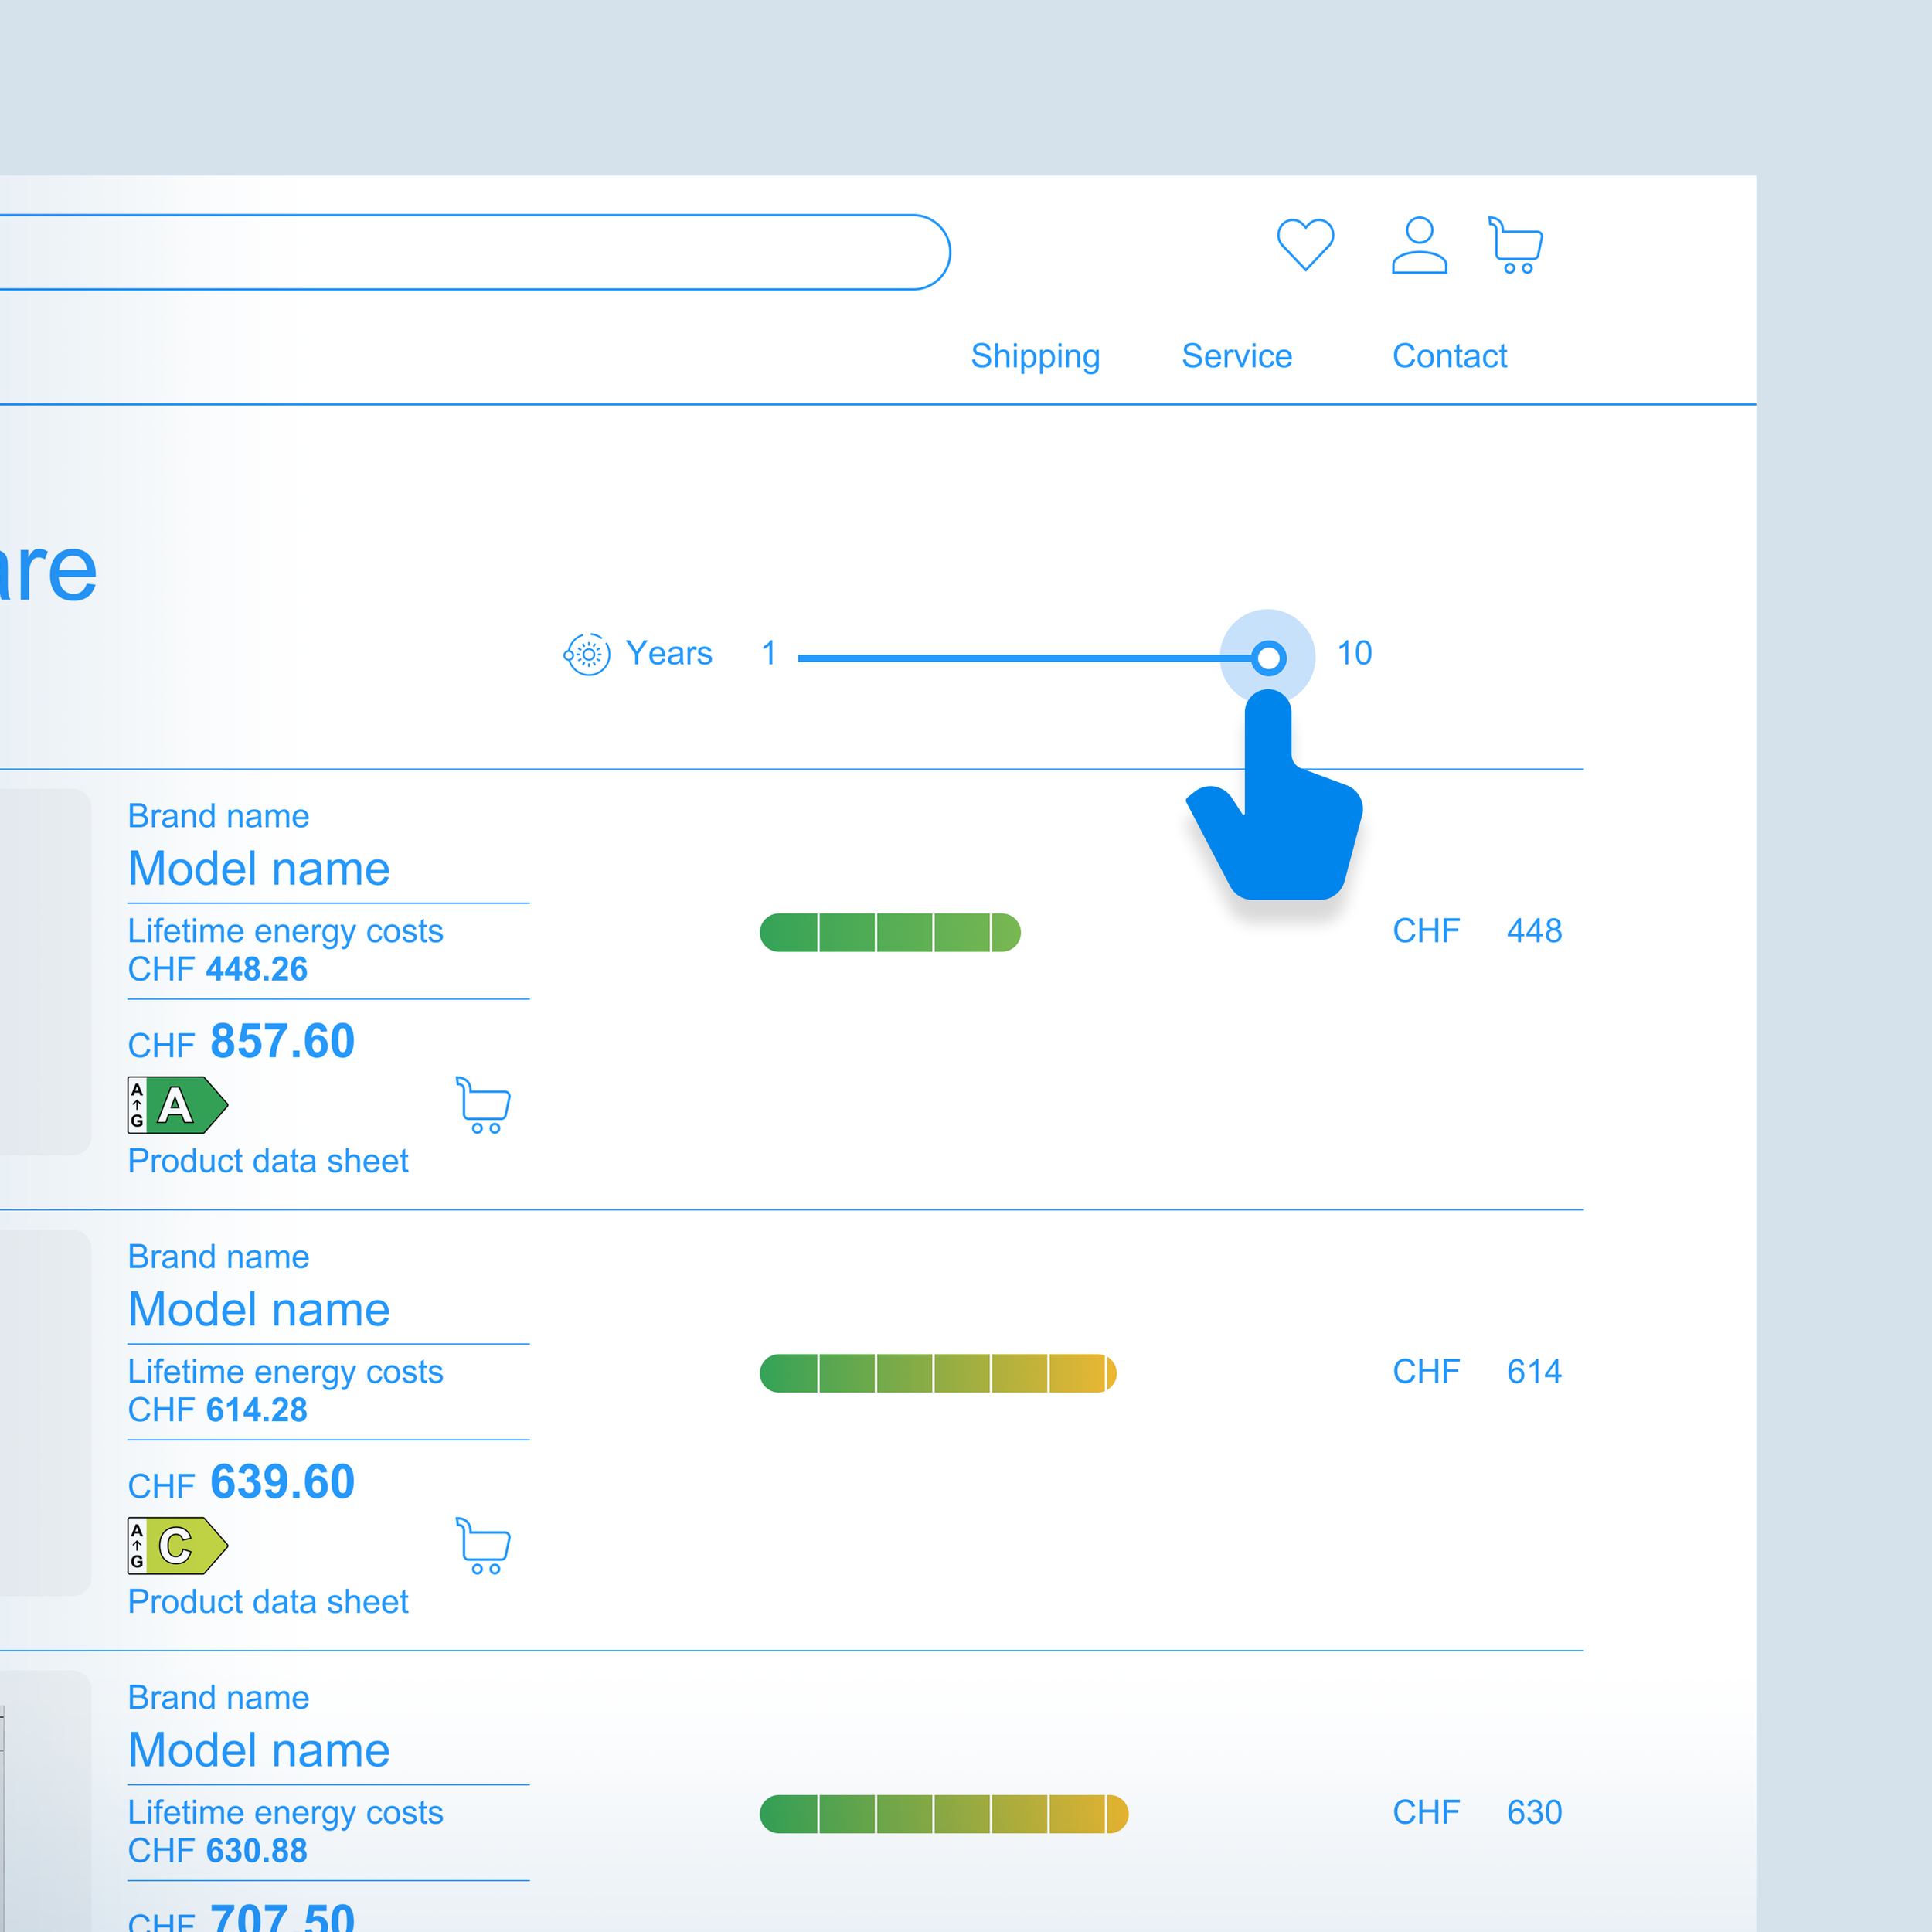
As the slider moves, each product’s accumulated energy cost is shown as a progress bar and as an increasing value.
Persona-Based Evaluation
Based on AI-assisted Personas

Progressive Purchaser
Initial perception
Recognizes the slider immediately as a modern comparison tool. The dynamic visualization feels more advanced and engaging than a standard product table.
Interpretation
Understands the pattern as a way to visualize the relationship between purchase price and long-term operating costs. The interaction turns the energy label into a measurable financial factor.
Marc is likely to inspect:
how quickly cost differences emerge
whether assumptions are credible
how the calculation is made
Effect on decision
Increases engagement with the comparison
Makes efficient products feel economically rational
Encourages deeper evaluation instead of price-only decisions
Strengthens trust when the methodology appears transparent
Friction / risks
Medium
If calculations seem oversimplified or biased, trust drops quickly. Risk remains manageable when assumptions are transparent, the visualization stays factual and the info layer explains the methodology clearly.


Cross-Persona Evaluation
Perceptibility: High
The slider is visually dominant and easy to understand once users enter comparison mode.
Comprehensibility: Medium–High
The basic principle is clear: more years reveal more running costs. The calculation logic needs an info layer.
Motivational fit: High
The pattern works across values-based, rational and savings-oriented personas.
Decision impact: High
It can shift attention from purchase price to total cost of ownership, especially when a more efficient product is more expensive upfront.
Backfire risk: Medium
The main risk is not rejection of the pattern, but distrust of the calculation.
Expert Evaluation
Score: 7 / 14
**************
Cross-Expert Summary
The slider received conditional acceptance. Experts found the idea innovative and useful for showing how purchase price and running costs change over time. The interaction can make long-term efficiency more concrete.
The main concern is effort. Some experts felt that this level of interaction may be too playful or demanding for customers who want a fast decision. The pattern seems strongest in comparison tools, product detail pages or advisory contexts rather than late checkout.
“Shows very clearly that investing in durability and efficiency pays off. Lifetime costs will become increasingly important.”
— UX strategist, Manufacturer